Enquiry Now

 Contact Us


 Check Out
 +44 20 4571 2395

 PRINCE2® Foundation and Practitioner Training


 Andy Trainer
 6 May 2009
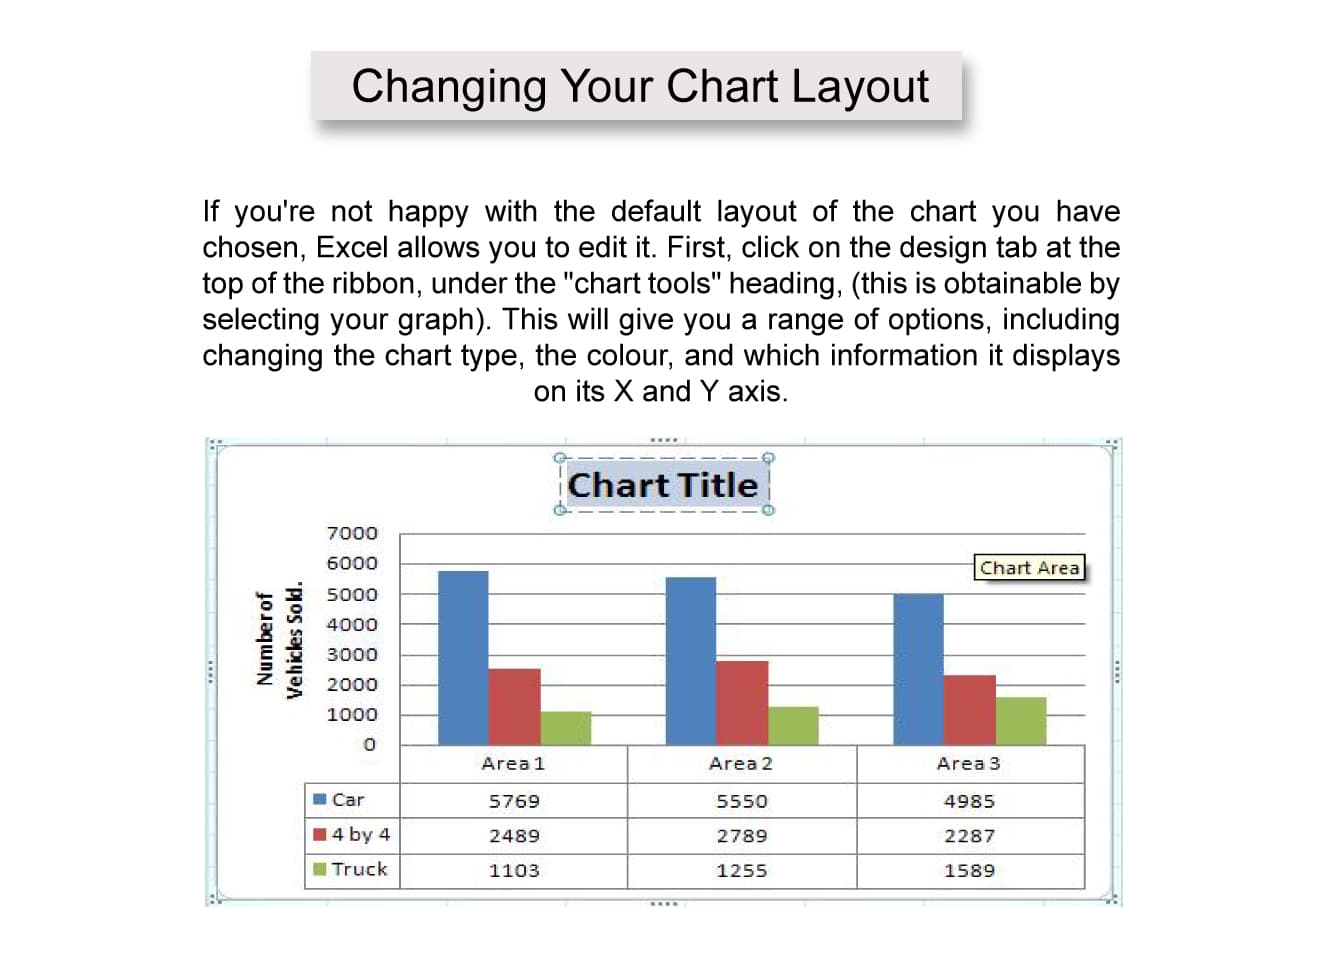
Changing Your Chart Layout
If you're not happy with the default layout of the chart you have chosen, Excel allows you to edit it. First, click on the design tab at the top of the ribbon, under the "chart tools" heading, (this is obtainable by selecting your graph). This will give you a range of options, including changing the chart type, the colour, and which information it displays on its X and Y axis.

In our example, select is layout 5. Excel 2007 will change your graph so that it now shows a main title, a title for the Y axis and a table of all the information used in the graph underneath the X axis.
In order to change the main title and the Y axis’ title all you need to do is to double click on the title itself and retype it.

Posted under:
 Need Any Help?
Recent Blogs