Andy Trainer
16 Aug 2012
Profile of Henry Gantt & the History of the Gantt Chart
When you come to us for training in PRINCE2, or to learn how to use Microsoft Project, we'll teach you about using Gantt charts to plan and track the progress of your project.
But what do we know about where they came from? Here’s a little bit about Henry Gantt, the brains behind the Gantt Chart.
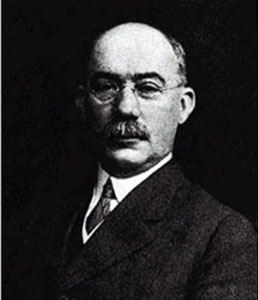
Henry Laurence Gantt
Henry Gantt was born in 1861 in Maryland, USA. He died in 1919 and developed the management tool that is the Gantt chart just after the turn of the century. He was educated at the Stevens Institute of Technology and became a mechanical engineer.
Gantt soon became known for his passion for economy/efficiency and for his sense of social responsibility. He was an advocate for the social responsibility of businesses and of applying scientific analysis to improve efficiency in industry. While he was a technician, he always strove to develop the most economical methods of production, and achieved a job role of “efficiency expert” at a textile plant in 1904.

After becoming known for the Gantt Chart in 1903, he developed the ‘Task and Bonus’ system of wage payment, which he advocated as a fair and efficient way of paying staff. This was based on the basic wage being based on an assumption of low performance (i.e. for workers learning the role), with bonuses being paid for meeting the expected proficiency and more for exceeding it. Managers were given bonuses based on the progress of their staff, thus ensuring that they would motivate staff not to rest on the laurels of the basic wage. (There are lots of other ways to motivate your staff, as taught on our management courses!)
Reproductions of his book Work, Wages and Profits are still available – Gantt used to refuse to work for anyone who hadn’t read and agreed with the principles outlined in the book!
The Gantt chart was by far his most lasting contribution, and he was posthumously honoured by the American Society of Mechanical Engineers which awards a Henry Laurence Gantt medal every year.
The History & Development of Gantt Charts
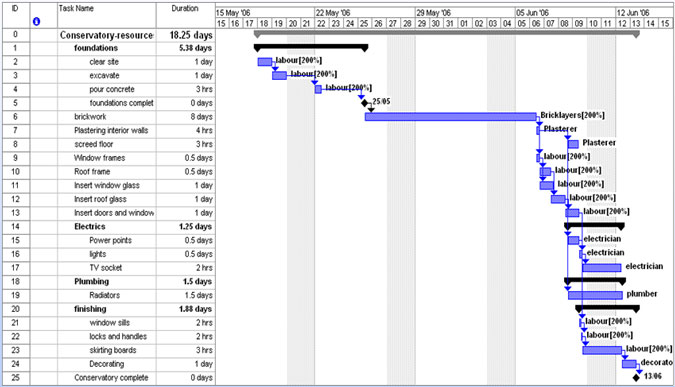
Used by project managers throughout the globe, the Gantt chart is a way of planning and controlling work done during a project; and allows easy recoding and monitoring of progress – whether the project is ahead or behind schedule.
Early versions of the Gantt had a rival tool developed by Karol Adamiecki, which worked in a very similar way. It’s thought that Gantt’s product won popularity over Adamiecki’s because Gantt’s was produced in a language more accessible to western industry.
The most high profile early use of Gantt charts was during the First World War. They have since been used in projects such as the construction of the Hoover Dam and the US Interstate highway network.
When personal computing took off in the 1980s, Gantt charts ability to be easily used digitally – and their usefulness in developing digital products – meant their use spread exponentially.

Project Management and Gantt Today
The use of software in project management has never been as important as in today’s world of online storage and cloud computing. Being able to access and update the same documents, calendars and data from remote locations means these are always kept up to date, in real time.
Flexible working in terms of time and location is becoming a staple of the modern workplace. Using Gantt charts, or similar, as a visual and continuous update of progress means less need for constant verbal updates, which is important if those involved are working different hours. The data stands on its own, without the need for further explanation.
The strengths and benefits of the Gantt chart means it remains a useful component of modern project management software. Its at-a-glance nature means different people on the project are always aware of its progress and revisions to the schedule. Having this data freely available means more accountability for project team; and easier communication between the Project Board, Project Manager, Customer and those working on the project.