Once you're happy with the chart type, you can also change the style so that the colours and fonts fit with the image you want to portray.
Again - select your chart and look at the "design" section of the ribbon. You will find the chart styles section on the right hand side of the ribbon. For more options, click on the “More” arrow as indicated below:

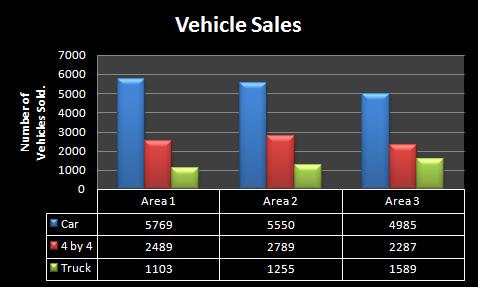
In our example, select layout 42 at the bottom of the list. Excel will then automatically apply this to your chart, like this:
Andy Trainer
6 May 2009
Once you're happy with the chart type, you can also change the style so that the colours and fonts fit with the image you want to portray.
Again - select your chart and look at the "design" section of the ribbon. You will find the chart styles section on the right hand side of the ribbon. For more options, click on the “More” arrow as indicated below:

In our example, select layout 42 at the bottom of the list. Excel will then automatically apply this to your chart, like this:

Andy Trainer
6 May 2009
If you're not happy with the default layout of the chart you have chosen, Excel allows you to edit it. First, click on the design tab at the top of the ribbon, under the "chart tools" heading, (this is obtainable by selecting your graph). This will give you a range of options, including changing the chart type, the colour, and which information it displays on its X and Y axis.
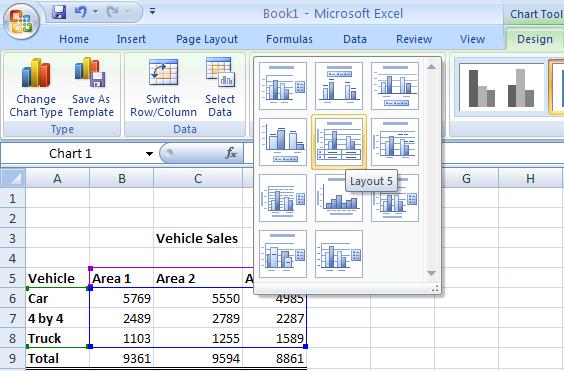
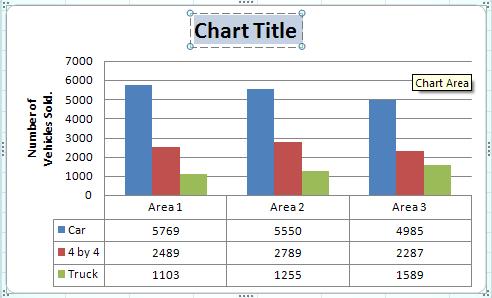
In our example, select is layout 5. Excel 2007 will change your graph so that it now shows a main title, a title for the Y axis and a table of all the information used in the graph underneath the X axis.
In order to change the main title and the Y axis’ title all you need to do is to double click on the title itself and retype it.
Andy Trainer
6 May 2009
If you're not happy with the default layout of the chart you have chosen, Excel allows you to edit it. First, click on the design tab at the top of the ribbon, under the "chart tools" heading, (this is obtainable by selecting your graph). This will give you a range of options, including changing the chart type, the colour, and which information it displays on its X and Y axis.

In our example, select is layout 5. Excel 2007 will change your graph so that it now shows a main title, a title for the Y axis and a table of all the information used in the graph underneath the X axis.
In order to change the main title and the Y axis’ title all you need to do is to double click on the title itself and retype it.

Andy Trainer
6 May 2009
Excel can create a range of graphs and charts based on data in your spreadsheet, including line, column, area, line, pie, scatter, and bar charts.
Once created, Excel graphs will automatically update to represent any changes in data that you may make.
Before we start you'll need a set of data so that you can give Excel something to make a graph out of. Copy the data shown below, or use something similar that's relevant to you.
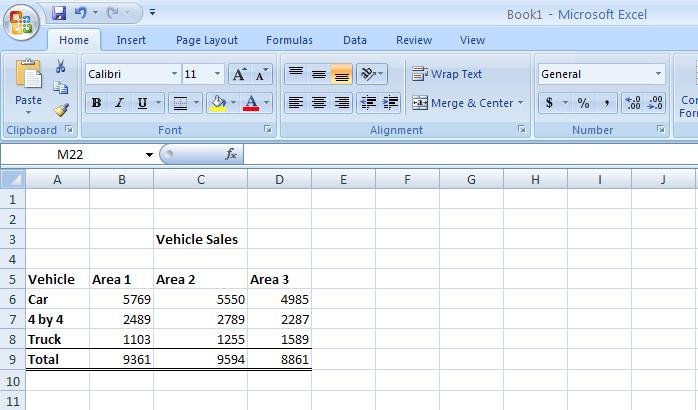
Using this example, highlight cells A5 to D8, i.e. all the information in the table apart from the total sales and the title. After you have highlighted the cells, click on the insert tab at the top of the ribbon which will give you a range of graph and chart options - select "column chart". You will now be presented with a list of column charts to choose from, select the “Clustered chart”; this is the first one in the list under the 2D section.
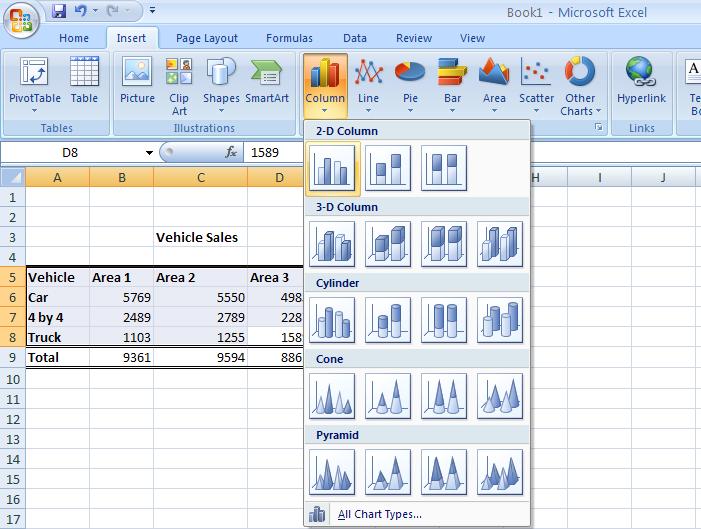
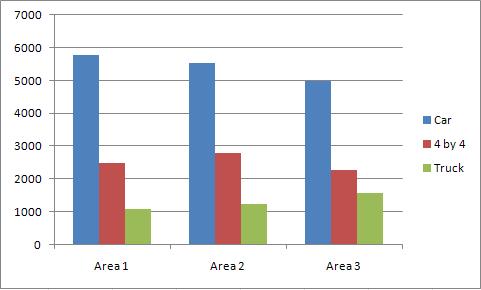
The following basic graph will appear containing the relevant information:
Andy Trainer
6 May 2009
Excel can create a range of graphs and charts based on data in your spreadsheet, including line, column, area, line, pie, scatter, and bar charts.
Once created, Excel graphs will automatically update to represent any changes in data that you may make.
Before we start you'll need a set of data so that you can give Excel something to make a graph out of. Copy the data shown below, or use something similar that's relevant to you.

Using this example, highlight cells A5 to D8, i.e. all the information in the table apart from the total sales and the title. After you have highlighted the cells, click on the insert tab at the top of the ribbon which will give you a range of graph and chart options - select "column chart". You will now be presented with a list of column charts to choose from, select the “Clustered chart”; this is the first one in the list under the 2D section.

The following basic graph will appear containing the relevant information:

Andy Trainer
6 May 2009
As a professional web developer or hobbyist designer, there are always ways to make the coding work you do faster and more efficient. With that in mind, we've put together a list of the 10 most useful cheat sheets a developer can rely on - everything from HTML5 to MySQL.
Of course , if you're struggling with the basics, you could always come on our HTML5 & CSS3 Course to kick-start your developing career.
Aaron Charlie
29 Aug 2013